Friday, February 21, 2014

About 100 flying particles

Daniel Strömbom and myself are organizing a symposium at the coming European Conference on Mathematical and Theoretical Biology. The title is the collective motion of about 100 particles.

The symposium is about collective motion of animals and cells. Models in which we describe how individuals form groups, move together and form spectaculr patterns. The title captures what we think is a central mathematical problem with these models. Mathematicians are good at solving problems that involve two or three interacting objects and it is good at solving problems that involve an infinite number of objects, where everything blurs in to a continuum. It is not very good at dealing with 100s and 1000s of interacting objects. It is exactly these numbers which are typical for interesting animal flocks, like starlings and human crowds.

We have four invited speakers James Anderson, Raluca Eftimie, Pawel Romanczuk and Kit Yates, all of who have very different approaches to the problem. We hope to create a lively discussion and debate afterwards and start to think about how to tackle this problem. We are now looking for a few more contributed talks. Please send an abstract to Daniel if you are interested.


Saturday, February 8, 2014

Facebook vs Princeton vs Sumpter

In an earlier post I wrote about how useful the logistic growth equation is in modeling different social phenomena. I thought it was fun then, when a logistic growth fitting war broke out between two Princeton PhD students and some Facebook researchers. John Canarella and Joshua Spechler put up a paper on arXiv fitting an adapted SIR disease model to My Space and Facebook searches on Google. Their SIR model is essentially two logistic growths put together: one for infection with Facebook and one for recovery afterwards. They predicted that Facebook was now facing a 'recovery' phase where people will stop using it, and this abandonment would spread through social infection. 

This result was reported in several places in the media, despite not having gone through any  peer-review. Facebook researchers were fast to do their peer review for them, pointing out that a whole range of search indicators show that Princeton is in terminal decline. The main problem for the Princeton study, according to Facebook, is that they don't show any causation, just a correlation. 

In my opinion, the Facebook researchers review fails to seriously address the possibility that we might be seeing a 'recovery' from Facebook. Unlike Princeton or Air (their other example), Facebook is actually a social media, and its success has spread through a social contagion. There is therefore an underlying causal reason for applying an SIR model to Facebook. Where the Princeton study is limited, however, is in the data set it uses. In order to do this study properly access is needed to the log-in events for the users of Facebook. Data which Facebook have, of course, and I can't imagine they are about to hand over to two graduate students at Princeton.

If Facebook do want to test whether they are in decline or not using log-in data, I can recommend the method Richard Mann and I developed to look at audience applause. We use exactly the same model as the Princeton guys, but fit it on individual events. Substitute hand claps for 'likes' and Facebook can find out how its going for them.

Anyway, all this is a digression. I thought it might be illuminating to do a study of my own meteoric rise in popularity on Twitter. In January, I surpassed 100 followers. I am still somewhat behind another collective behavior Twitterer, Simon Garnier, who just announced his passing 1001 followers. On the right I show my increase in followers and I fit the logistic equation to the data. I was shocked to find out that I have already entered a 'recovery' phase. According to the fit, my following has leveled off.

Luckily, none of these results are statistically significant and my ultimate following could be anywhere between 120 and 7 billion. So keep following!

If anyone out there wants to check their own following in Twitter, I include the Matlab code to do this below. All you have to do is add the days since starting and along with the number of additional followers you have got on those days, and you too can know if you too are still a social contagion.


Friday, January 24, 2014

Explaining things with flow

This week our group’s first full paper on modelling socio-economic systems came out in PLoS One. The idea for this article came up when I saw Hans Rosling’s presentations of Gapminder. When you see how Rosling's bubbles representing countries float up from poverty and low life expectancy towards a better world you can’t help be inspired by the power of data.

Watching Rolsing’s videos, I also thought about fish movements! We have been using dynamical systems and Bayesian model selection to identify the models which best fit the rules of motion of fish. If we can think of countries as fish then we could use the same methods to find the rules of motion of countries in a socio-economic space, rather than a fish tank.


There turned out to be quite a lot of differences, as well as similarities, between fish and countries. But keeping this initial analogy in mind, Shyam Ranganathan and Viktoria Spaiser have developed a toolbox in R for finding the best set of differential equation models that describe socio-economic change. In the paper, we apply these methods to democracy and economic growth. You can see more about this in the video on the right. Not quite up to Rosling enthusiastic standard of simplifying things, but I hope it illustrates the idea behind the paper.

We are now applying this method to look at the demographic transition, the changes in cultural values across the world, as well as segregation in schools. Most of these projects are based at the Futures Institute in Stockholm. The idea in the paper is to present the tools, rather than make predictions. But we hope that future work will lead to useful insights in to how the world is changing and what we should do about it. 

Please contact us if you have data that you think can be analysed using this method. 


Monday, January 20, 2014

Anti-social extinction

During a recent trip to New Zealand, I visited a couple of bird conservation projects. One was for the rarest of thefour species of Kiwi birds, the other for yellow-eyed penguins. Both these conservation projects are doing an amazing job keeping the animals living in their natural environment, while allowing tourists like me to get a look atthem and develop some insight in to conservation issues.

A yellow-eyed penguin couple and baby penguin.
My wife commented that it was ironic that, given I prefer group-living animals, we were visiting two anti-social species. Kiwis pair for life and jointly care for one egg at a time. But when the egg hatches they first ignore the newly hatched bird, and when it they gets bigger they just chase it away. The yellow-eyed penguins also form long-standing couples (although homosexuality, divorce and season long infidelities do occur) and invest in joint parental care. But once their offspring is big enough to fend for itself, it has to find its own territory.

A group of blue-eyed penguins
This anti-social behaviour makes conservation difficult, simply because more space is required for a sustainable population. I was struck most by this when we saw a colony of blue-eyed penguins on a nearby cliff. These birds also form breeding pairs, but are happy to live in close proximity to other blue-eyes and a vast array of seagulls. Blue-eye penguins are more numerous and wide spread in New Zealand and, although we shouldn’t become blasé, they are not endangered.

What I hadn’t thought of before is that the difficulty of conserving solitary-living species could help explain the evolution of sociality. Animals that are difficult to conserve are prone to extinction when their environment changes. Penguins that tolerate each other have to share local nesting resources, but if space suddenly becomes limited they don’t waste time and energy fighting with each other. Territorial penguins might be able to chase off more tolerant penguins and dominate the best nests, but if their territory comes under attack by a predator, for example, they are not welcome at their neighbours place.

Developing an argument about evolution of territoriality requires a model defined in terms of selfish individuals, not species success. My evolutionary penguins are playing some form of a ‘tragedy of the commons’ game, where in a stable environment selective pressure acts to make them more territorial. In an unstable environment, where territories can suddenly become unusable, selection may favour greater tolerance. When danger arises penguins that tolerate each other can congregate in the few available sites. Provided that penguins can only migrate locally, then local extinctions of territorial penguins who start fighting over the few available resources can lead to the evolution of greater tolerance for neighbors. 

The penguin model I sketch above is related to the idea of r and K selection popular in the 1970s and 80s, and now replaced by more general life history models. In environments where everything is stable (limited by the carrying capacity K) it is better to defend your territory. When territories are shifting (growth rate r is more important) then defense of these territories is less important and it is more important to do well in the space that can be found. I have to admit I don't know much about the literature that links together evolution of co-operation with life history strategies. I found one review of co-operation (a bigger step than just tolerating each other). Maybe people working on the evolution of co-operation should stop bickering over nothing and get a bit more biological detail in their models.

Disclaimer: I don't think my penguin model is necessarily a good description of what actually happened in real penguins. It turns out that modern yellow-eyed penguins may well have arrived with humans in New Zealand.

Friday, January 17, 2014

A picture of two penguins


I have been having a bit of an extended holiday over Christmas till now. Since New Year I have been in Australia and New Zealand. From Monday, I will be in Sydney on sabbatical until the start of April. Visiting Ashley Ward and his growing research group.

And I will be back to blogging soon. We have a paper coming out on Monday on our dynamical systems methods for studying socio-economic systems, I am going to write something inspired by my holiday about why solitary living animals might be more at risk of extinction than those living in groups. I have had a couple of students finish interesting projects, one on evolutionary game theory of poker and one on studying the pop charts, which I want to write about. And I might even do an analysis of my Twitter following (still quite low, but growing).

Photo: Elise Sumpter
In the meantime, here is a picture of a couple of yellow-eyed penguins. Sadly, two of just 4000 left on the planet. 

Wednesday, December 18, 2013

The rationality paradox

Dog-Eat-Dog by Ruth Graham
There are important differences between humans and other animals, and we should account for them when trying to model their respective behaviours. One difference is that humans can understand mathematical models, while there is no known example of this in animals.

In economics, the Lucas critique is a useful piece of advice about modelling human behaviour. It alerts us to the fact that if people are aware of the model we are using to predict their behaviour, they can adjust their behaviour to exploit our naivety. Even if they don’t know the exact model we are using, if we have not accounted for their strategic behaviour, they can still take advantage of us.

One paradox about the Lucas critique goes as follows. Lets take the classic example of a model, called the Philip’s curve, used by central bank managers to set inflation and try to reduce unemployment. This model is subject to exploitation by rational firms who can manipulate their employment patterns given that they know the inflation strategy of the bankers. As a result, the Philip’s curve will fail to make a correct prediction and is thus subject to the Lucas critique.

This is a reasonable observation, but why are the firms assumed to be rational and the central bank managers irrational? Surely, these highly qualified, trained economists would have thought of this possibility and incorporated the reaction of the firms into their model? This is all the more surprising when you consider that firms have many other things to think about than inflation five years in to the future. Apparently, on top of all their immediate concerns about their business model, staffing problems etc. these firms have dedicated their time to finding loopholes in the central bank’s thinking.  Why should the bankers (apart from Lucas, of course) have missed this fact, while the firms are able to work it out?

Any Lucas-inspired model of these bankers behaviour should not allow them to use the Philip’s curve in the first place. The only logical conclusion of this line of reasoning is either that the observations of the economists using Philip’s curves was mistaken or it was some temporary insanity which is replaced by a steady state rationality in the future.  

When we build a mathematical model of human behaviour, the Lucas critique should be taken seriously. Understood properly, it says you should think a few steps ahead when making your model. Does your model make sense? Lucas was pointing out that the Philip’s curve model has a particular type of limitation. We should remember this limitation when we are building models. The Lucas critique is one of many such limitations.

But the paradox tells us that the Lucas critque should not be taken too seriously either. Taken to an extreme, the critique says that the only thing economic models should be used for is studying the outcome of rational interactions. If this were the case, then the paradoxical question is why economics exists at all? The rationality assumption is that people are able to work out the consequences of their actions and therefore we don’t need an economist or anyone else presenting them with a model of what those consequences might be.

This description is typical of paradoxes in mathematics where we want to say something about a model using the model itself to say it. Last month I wrote a blog post about Bertrand Russell spending 20 years doing this to no avail in trying to establish the axioms of mathematics.  It just isn’t possible.


I was prompted to write this after a blog post by Simon Wren-Lewis that Richard Mann tweeted me. Although I find scathing attacks on economics amusing, I find it difficult to believe that economists or anyone else takes the Lucas critique as far as appears to be claimed.  This would be completely irrational. I also doubt whether, as is also claimed, that we can really attribute the economic crisis to models based on rationality.  But it is certainly fun thinking about it.

Tuesday, December 10, 2013

Positive online emotions

Emotions and mathematical models are perhaps polar opposites. Emotions consist of personal opinions, they are unlikely to be rational and they can change in a second. Mathematical models are logical, rational, descriptions of the world that are meant to stand the test of time. But that doesn't mean that we can't model emotions, or at least this is was what Frank Schweitzer claimed in his seminar at the Futures Institute last Friday. Before Frank's talk I was a bit skeptical, but I was interested to find out if he could really build an emotional model.

In order to model something, you first need to measure it. You need to be able to assign a number to an emotion. Since emotions are already either positive or negative, we already have a natural way to assign them values. Most of us can read a text and agree on whether it has a positive or negative tone. But can we automatically assign a number to emotional content on the basis of this assessment? Frank and his colleagues have adapted the software SentiStrength, which claims to be an algorithm to do exactly this. You feed it in a sentence and out pops a ranking. I put in the last sentence of the previous paragraph in to the online version and got negative score -2 for the words 'skeptical' and 'emotional' along with a positive score of 2 for 'interested'. Good to see I was emotionally neutral going in to the seminar.
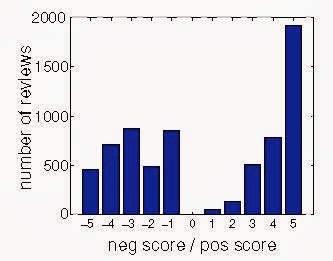
Review sentiment distribution for
 'Harry Potter and The Deathly Hollows'

In one study, Garcia & Schweitzer looked at book reviews left on the Amazon website. There was a typical distribution of negative and positive emotions in these reviews (pictured on the right) where positive comments were typically extremely positive and negative criticism was varied. The time pattern of review writing varied, with some books building up a review base over time and others (such as Harry Potter) being hyped from the start.

Things get even more interesting when Frank and his colleagues looked at online chat rooms. They examined how long it took between interactions and whether the reactions were positive or negative.  They found a common distribution for the times between posts, which was independent of the topic. They concluded that people were surprisingly positive in their online interactions, even though previous studies had suggested that discussion is generated by negative opposing opinions. When online, people spend a lot of time being nice to each other! Not just pressing the like button, but also in constructive agreement.

Time series of emotions in
an online chat room. 
The team have built up a mathematical model of emotions, which they use to explain the patterns they see. The basic idea of the model is that people change both in how aroused they are and in whether they feel positive or negative emotions. Positive inputs provide positive expressions, while negative inputs enforce negative expressions. The arousal depends on the intensity of the inputs. This model can reproduce many of the properties of the Amazon data and the online chat rooms.

In another part of their work, Frank and his colleagues argue that “positive words carry less information than negative words”, so I better be a bit critical.  In the presentation, and the papers I have looked at since, I think a model comparison to the dynamics of the conversations and exchanges is missing. The model proposed captures the rate at which people comment and the positive/negative content of what they say. But the comparison to data is mainly at the level of time between posts or overall distribution of sentiment, rather than looking at the positive/negative interactions. I would like to see something down the lines of James Murray and co-workers on the Mathematics of Marriage. Here there is a description of how couples get in to negative/positive spirals and  predictions to how this bodes for the futures of the relationships of the couples involved. Murray’s work lacks thorough validation against data, and maybe it becomes too complicated once the fast amount of chat room data is put in to a model, but I would like to see more of these interaction dynamics. Maybe this is in some of the work and I have just missed it? Or maybe it is just too difficult at present? But I would be interested to see what can be done.